
2025 College Football Analysis, Part Eight: Bad Betting Advice
While hammering through the math of a college football simulation is fun, is it possible to make a little cash along the way? Welcome to Bad Betting Advice.
Over the past few weeks, I have taken you on a journey across the college football preseason landscape. I have reflected back on the data from 2025 and conducted a detailed analysis of the schedule for the Michigan State Spartans. I have analyzed the races in the Big Ten, the rest of the Power Four, and in the Group of Five. Most recently, I have made some predictions regarding the 12-team college football playoffs.
In the first seven installments of this series, I have discussed a multitude of odds that I have generated using a simulation of the full college football season. In today's final installment of our college football preview, we will explore whether these odds might just help us win a bit of money.
That's right, it's time to officially kick off the 2025 edition of Dr. Green and White's Bad Betting Advice.
The Big Picture
The results of my full season simulation provide a variety of odds that can be compared to common betting lines available from any common sports book. These include the odds to win a division and/or qualify for a conference championship game, the odds to win the conference, make the playoffs, and win the National Championship.
Table 1 below summarizes the odds for all these events for the preseason top 25 according to the consensus of the preseason publications.
Table 1: Summary of the conference championship, playoff, and national title odds for the top 25 teams in the 2025 season. The odds from my simulation are compared to the odds from Draft Kings in order to generate a potential return on investment.
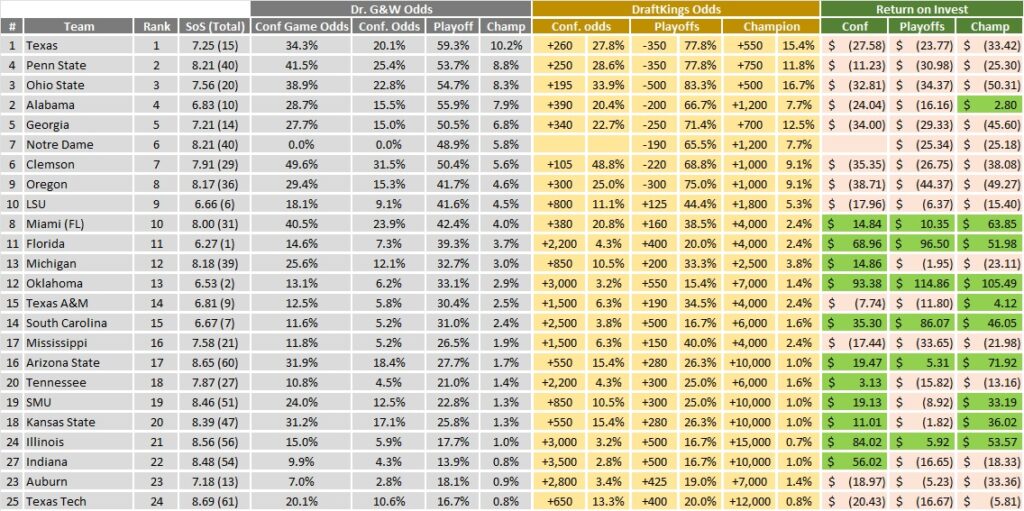
Table 1 includes the preseason rank and strength of schedule (and SoS rank) for each team. It then lists the odds for each event based on my simulation results. The middle of the table shows the Draft Kings money line odds for each of those bets. I have converted those money lines to the equivalent odds so that they can be easily compared to the simulation odds.
Finally, the right side of the table gives the return on investment (ROI) for each potential bet of $100, assuming the odds from my simulation are the true odds. I have shaded each potential bet with a positive ROI as green.
As expected, the overall odds of winning the national title correlate closely with the preseason rankings. Preseason No. 1 Texas has the best odds to win the National Championship (10.2%), followed by No. 2 Penn State (8.8%), No. 3 Ohio State (8.3%), No. 4 Alabama (7.9%), No. 5 Georgia (6.8%), and No. 6 Notre Dame (5.8%).
Note that the playoff odds for the teams in the top 10 all hover around 50%. This suggests that roughly half of these highly ranked teams in the preseason will actually make the college football playoffs. Some of these teams will likely be worse than expected, while others will wind up taking one too many losses. In my disruptive scenario, No. 4 Alabama (9-3) and No. 9 LSU (8-4) both wind up on the outside looking in.
Note that around two-thirds of these bets have a negative ROI. This is not surprising, as the folks in Las Vegas are experts at setting the line just above the real odds such that the house always wins.
But there are a few teams that have a positive ROI for at least one of three events captured in this table. Miami, Florida, Oklahoma, South Carolina, Arizona State, and Illinois all stand out as teams with positive ROIs in all three categories.